
Para acceder a la versión en castellano click aquí
To begin with, I would like to advance a theoretical position: cities are essentially labor markets (Bertaud, 2018), their efficiency determines the capacity of the city to produce added value and therefore to generate wealth, this will allow better conditions of wellness. The conditions of agglomeration and scale of the cities allows the existence of a “new-job” that creates better economic conditions for citizenship and economic dynamics for societies (Jacobs, 1970). A model of how cities work should show how this is explained in the shape of the city and in the structure of land use in it.
Before continuing, it’s necessary to elaborate on what we understand as a model of urban development. It’s a schematic representation of reality, for which data is taken in a synthetic way, that is, the relationship between some variables that explain, according to the theory, the behavior of a phenomenon is presented, in this case urban development or the dynamics of the cities. Then, the urban development model is built from some variables that, according to the theory, are the ones who explain the behavior of the city and determine how they relate between themselves and how they explain the behavior of the city. Explicitly, in this case, it explains the logic behind the location of urbanistic activities.
Quickly reviewing some theory, if we consider that the city is a permanent market settlement (Weber, 2014) in which economies of scale and agglomeration generate greater productivity (Camagni, 2005), which is precisely the reason why cities exist [1], then the theory should explain to us how this agglomeration should be distributed in the territory in order to make this function more efficient. Theory regarding how activities are deployed in the territory depending on the efficiency of the location, have existed since the Von Tunen Model (early 19th century), which is the basic model for the location of economic activities. From Von Tunen, the Urban Monocentric Model emerged between the 60’s and 70’s of the last century, and through the work of William Alonso, Edwin Mills, Richard Muth and William Wheaton, the Urban Monocentric Model whose graphics can be seen in Graph 01.

The conditions for this Monocentric Urban Model are the following: it unfolds in an isotropic territory, therefore the cost of transport is a linear function at distance, at the origin is the Central Business District (CBD) where all the jobs are concentrated and, in geometric terms, it occupies a point. CBD has said that all inhabitants attend to work; and the model also considers that the inhabitants assume them transportation costs.
The model considers that citizens choose the best relationship between housing (h) and services (z) that are also located in the CBD. That is, citizens will choose between these two consumptions the most convenient arrangement for them, which is why Graph 01 has the form of a budget limit, where the utility is given by the consumption of (z) and (h).
u(h,z)[2]
According to the graph, while the dwelling (on the abscissa axis) is closer to the origin, the people will have more access to (z); Likewise, they must pay for their homes at a price P (x) of (h) according to their location (in x), they receive a salary ![]() for their work and finally the transportation costs are t (x), that is, the transportation costs of living in x. With this, it can be established that the arrangement between the consumption of services (z) and housing (h) should be assumed by the salary after transportation costs, for a point (x), which is:
for their work and finally the transportation costs are t (x), that is, the transportation costs of living in x. With this, it can be established that the arrangement between the consumption of services (z) and housing (h) should be assumed by the salary after transportation costs, for a point (x), which is:
w – t(x) = P(x)h + z
People will establish their location in the city according to their decision to take «more» housing or «more» services, said location that would imply (t) transport costs; all of which must be assumed with the salary (w). It is important to mention that the slope of the line depends on the preferences of the workers, some will prefer more (z) others more (h), but all are limited by income, if this increases there could be a greater consumption of (h) or of (z)[3] in an aggregate way. The mathematics behind this analysis can be reviewed in this presentation by Dr. Florian Oswald from SciencesPo from Paris.
According Dr. Oswald, some important things can be concluded from the model:
- When consumers move away from the center, home prices decrease but transportation prices increase.
- Therefore, housing consumption (which could translate into larger area or lower priced homes) increases as we move away from the center.
- The value of the land corresponds to the upper envelope of the housing supply of consumers (that is, the highest rent that the inhabitants can pay), if the value of agricultural (or non-urban) land does not increase (if the value of agricultural land will increase, the urban edge would move to the left, towards the origin)[4].
- The population density decreases as we move away from the center.
- The intensity of land use (or the intensity of capital use in realized buildings) decreases as we move away from the ground.
And this last conclusion is truly important, it is at the center of the regulatory status of urban planning. Indeed, the volume of the land consumption in floor area expresses the intensity of urban land use, which is a function of its rent. However, the building potential of urban land is a regulatory condition determined by local governments, which is effectively the instrument they exercise to order the urban development of our cities.
Alain Bertaud in his great book «Order Without Design», expresses the above as the «Urban Standard Model» (but indicates that it is the same model), whose graph can be seen in Graphic 02 .
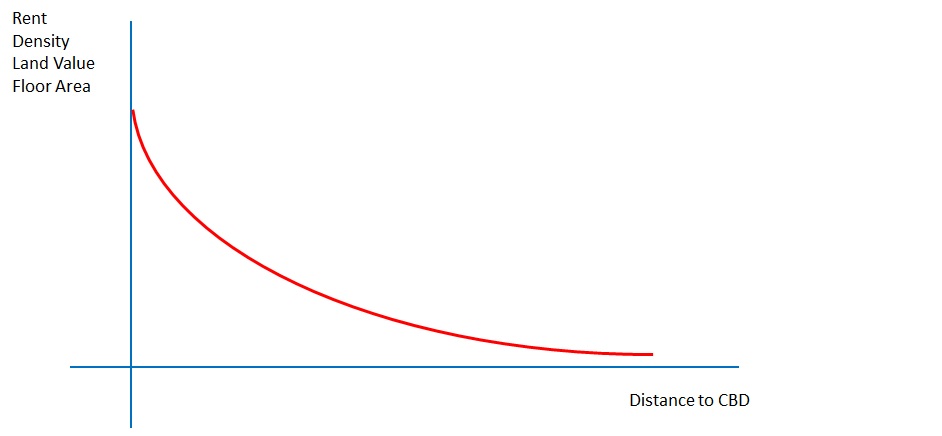
The curve that expresses Density in a first analysis (but also shows Rent, Land Value and Floor area Ratio) is an exponential function of “e”, in the following terms:
f(x) = D0 e-gx
Where D0 is the density at the origin and g is the gradient of the curve.
It is important to remember what Bertaud indicates regarding the identity between Density, Land Value and Floor Area that this model raises. Whose higher values will be towards the CBD and then, through the gradient of the function, they will decrease away from the center. This means that in a city “normally” the highest densities, the highest land values and the highest Floor Area Ratio (FAR) will have the same spatial distribution, and will be concentrated in the centers. In terms of zoning, the major zoning parameters will be in the centers or central axes. Or in other words, the land with the highest market value is the one that must withstand the highest occupancy intensities, the highest zoning.
This model even allows us to establish the conditions to calculate how much the FAR should be in certain areas of the city. For example, in the interval [a, b] of Graphic 03, the way to calculate the FAR, using the Urban Standard Model, would be by calculating the integral of the urban rent / FAR function in the interval of the urban area that we want to design or regulate.

In this way, the urban development model allows us to identify the urban parameter that will be part of the regulatory process, within the framework of urban planning and the administrative processes of urban development management.
From the Urban Standard Model, multiple models of urban development can be built, depending on how the variables that explain the shape of the city are displayed. In other words, the urban diagnosis should identify the variables that explain the urban development of the city and the modeling of urban development should be the step between the diagnosis and the formulation of the proposal.
There are a large number of models for urban analysis; of course each model must be explicitly calibrated for each city, the one presented in this post is just a very schematic model to understand concepts. In order to determine regulatory conditions for the land and transportation market, ad-hoc models must be generated. As an example, we can review the UrbanSim Model generated by Dr. Paul Meddell from the University of California, Berkeley[5], the pioneer TRANUS by Dr. Tomas de la Barra, the Urban Sintax developed by Urban Planner Tim Stonor, applied by Urban Sintax Limited[6] [6] and UCL Bartlett in its Online Training Platform or RELU TRAN developed by Dr. Alex Anas of the University at Buffalo, State University of New York. It is important to mention that all these models model (that is, they explain and anticipate) both urban land uses and transport flows, since they are the same unit and the solutions for one are found in the other.
The Metropolitan Planning Institute within the framework of the formulation of PLANMET 2040, led by Architect José García Calderón, has generated an Urban and Territorial Development Model that culminates in a dictionary of variables that must be quantitatively modeled to generate the future development scenarios. However, this modeling should be discussed with the modeling carried out by the Lima and Callao Urban Transportation Authority.
The generation of urban development models allows, in a scientific way, to determine the regulatory conditions of urban development (you can also review this other post where I developed the relationship between transport, labor market and informality and which collects several concepts from this post). The generation of qualitative data, its management and conversion into regulatory parameters, is the way to plan cities. For this we need to generate spatial data management systems that allow us to have constantly updated information and of course generate mathematical models for urban analysis, a rather long task that requires not only improvement of computer resources, but and above all, demand for better human Resources.
Note: the header image of this Blog corresponds to the spatial distribution of the population in Jakarta, London, Paris and Gauteng, developed by Alain Bertaud in this document, by the way I recommend visiting his personal web page. This image is being used under his authorization.
References
Bertaud, A. (2018). Order without Design: How markets shape cities. In Order without Design: How markets shape cities (1st ed.). The MIT Press. https://mitpress.mit.edu/books/order-without-design
Camagni, R. (2005). Economía Urbana (1ra ed.). Antoni Bosch, editor, S.A.
Jacobs, J. (1970). The Economy of Cities. Random House Inc.
Weber, M. (2014). Economia y Sociedad (3ra.). Fondo de Cultura Económica.
[1] A very interesting explanation of why a city exists can be seen in this video (in Spanish) by Ciro Biderman from the Lincoln Institute of Land Policy https://www.youtube.com/watch?v=BYFgiDlLNWY
[2] A digression: could environmental quality be placed as another factor to consume? In such a way that the citizens’ choice could be u (h, z, a), where (a) is precisely the environmental variable. In this way, citizens would choose between consuming housing, consuming services and consuming environmental services, this, of course, would substantially modify the model.
[3] Further analysis should add the indifference curves, to avoid getting too off topic, we will leave it for another occasion.
[4] And here we could even make another digression, the non-urban land around Metropolitan Lima Area is of two types: dust-land and agricultural, so that the urban edge does not absorb them, that is, that they do not become urban, the income as urban land should be less than the non-urban rent (as agricultural or as dust-land), however, agricultural rent in the valleys around Lima is constantly decreasing and the rent from dust-land is close to zero.
[5] Originally this is the model that the “Instituto Metropolitano de Planificación” (Planning Metropolitan Institute) of Lima considered to apply in the urban planning of the city.
[6] Urban Syntax Limited is the one who made the analysis and proposal for urban regeneration of London on the occasion of the 2012 Olympics, and one of whose images I use as the head of this blog.

Un comentario en “An Urban Development Model”